

Introduction:
Have you ever looked at a stock’s price and wondered, “Is this a bargain or a rip-off?” Well, you’re not alone! In the world of investing, one of the most powerful tools to answer this question is hiding in plain sight: the Price to Earnings (PE) ratio. It’s like a secret decoder ring for stock prices, and today, we’re going to crack the code together!
Imagine you’re at a stock market buffet. The PE ratio is your calorie counter, helping you decide which stocks are worth putting on your investment plate. But here’s the kicker – in 2023, the average PE ratio for the S&P 500 was hovering around 21. What does this mean for you and your money in 2024? Buckle up, because we’re about to dive deep into the world of PE ratios and emerge as smarter, savvier investors!
What is PE Ratio? Decoding the Investor’s Crystal Ball

Let’s start with the basics. The PE ratio isn’t just another boring financial metric – it’s the Swiss Army knife of stock valuation tools. But what exactly is it, and why should you care?
Defining PE Ratio: More Than Just a Number
The Price to Earnings ratio, or PE ratio for short, is like a snapshot of a company’s stock price relative to its earnings. It tells you how much investors are willing to pay for each dollar of a company’s earnings. Think of it as the price tag on a company’s profit-making ability.
The Magic Formula: Calculating PE Ratio
Ready for some quick math? Don’t worry, it’s easier than ordering a coffee! The basic PE ratio formula is:
PE Ratio = Market Price per Share / Earnings per Share
For example, if a stock is trading at $50 and the company's earnings per share is $2, the PE ratio would be 25 ($50 / $2 = 25).
Why PE Ratio Matters: The Investor’s Crystal Ball
So why do investors obsess over this number? Well, the PE ratio is like a crystal ball that gives us a glimpse into market expectations. A high PE ratio might suggest that investors expect high growth in the future, while a low PE ratio could indicate that a company is undervalued – or that it’s facing some serious challenges.
Real-World PE Ratios: A Tour of the Stock Market

Let’s look at some real-world examples to bring this to life. As of August 2024:
1. Apple (NASDAQ: AAPL): PE ratio of 28
2. Amazon (NASDAQ :AMZN): PE ratio of 60
3. ExxonMobil (NYSE :XOM): PE ratio of 10
These numbers tell us different stories. Apple’s moderate PE suggests steady growth expectations, Amazon’s high PE indicates high growth expectations, while ExxonMobil’s low PE might suggest it’s undervalued or facing industry challenges.
PE Ratio Meaning: More Than Just a Number

Now that we know what PE ratio is, let’s dig deeper into what it really means. It’s not just a number – it’s a window into the soul of a stock!
High PE vs. Low PE: What’s the Deal?
A high PE ratio often means investors expect the company to grow rapidly in the future. It’s like betting on a racehorse with a great track record. On the flip side, a low PE ratio might indicate that a company is undervalued, or it could be a warning sign that the company is in trouble. It’s like finding a designer handbag at a thrift store – it could be a steal, or there could be a catch.
Industry Matters: PE Ratios Across Sectors
Here’s where it gets interesting – PE ratios can vary wildly across different industries. Tech companies often have higher PE ratios because investors expect rapid growth. Utility companies, on the other hand, typically have lower PE ratios due to their stable, predictable earnings. It’s like comparing apples to oranges – both fruit, but very different!
The Psychology of PE: What Investors Are Thinking
PE ratios are as much about psychology as they are about math. A high PE ratio might reflect investor optimism or even over-exuberance. A low PE could signal pessimism or a hidden opportunity. It’s like reading the mood of the market – are investors feeling bullish or bearish?
PE Ratios Over Time: The Market’s Heartbeat
PE ratios aren’t static – they change over time, reflecting the ebb and flow of market sentiment and economic conditions. During bull markets, PE ratios tend to expand as investors become more optimistic. In bear markets, they often contract as fears take hold. It’s like watching the market’s heartbeat on an EKG!
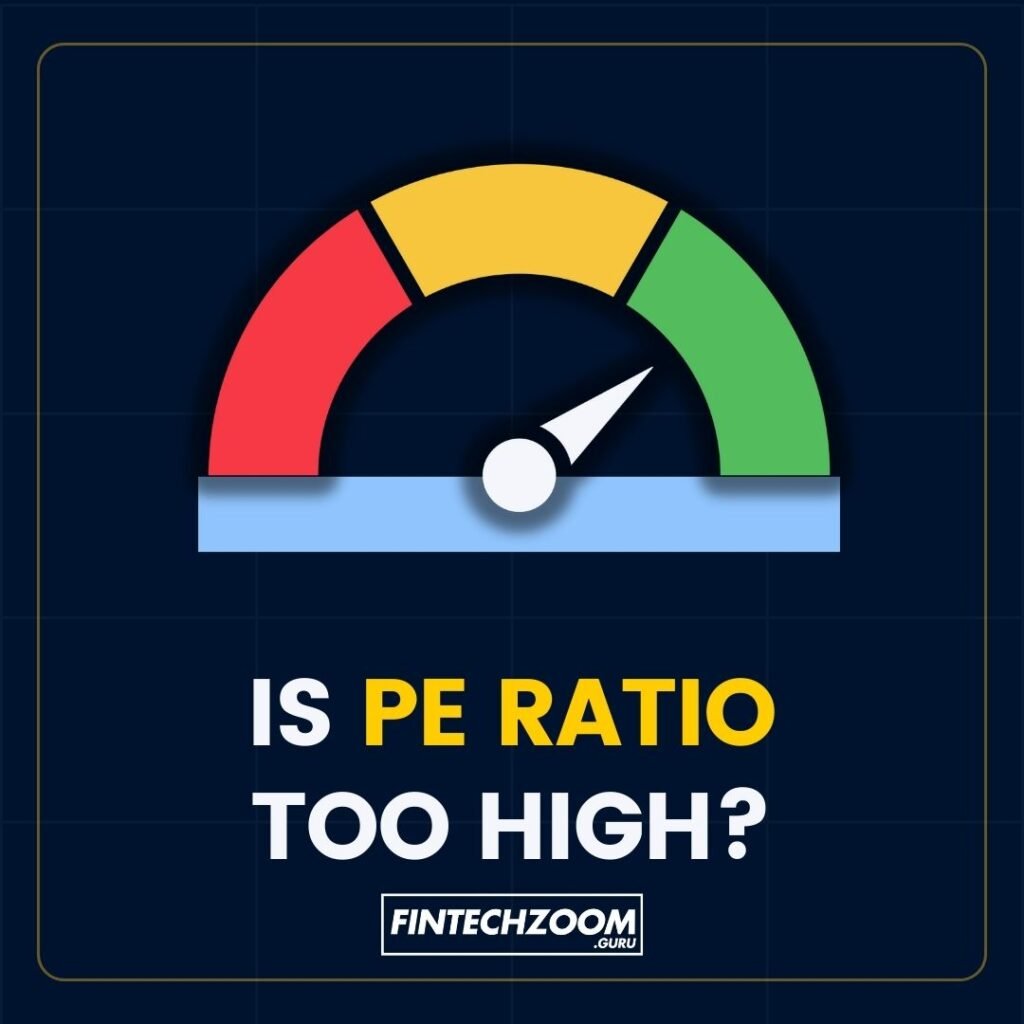
What is a Good PE Ratio? Finding the Sweet Spot
“What’s a good PE ratio?” It’s the million-dollar question every investor wants answered. But like many things in life, the answer is: it depends!
The Goldilocks Zone: Not Too High, Not Too Low
Generally, a PE ratio between 15 and 25 is considered moderate. Below 15 might be considered low, potentially signaling an undervalued stock. Above 25, and you’re in high PE territory, which could mean high growth expectations or overvaluation. But remember, these are just rules of thumb – not hard and fast rules!
Industry Benchmarks: Comparing Apples to Apples
To truly understand if a PE ratio is “good,” you need to compare it to industry peers. For example:
– Technology: Average PE ratio around 30-40
– Utilities: Average PE ratio around 15-20
– Financial Services: Average PE ratio around 12-15
These benchmarks can help you gauge whether a stock’s PE ratio is reasonable within its industry context.
Historical Context: Learning from the Past
Looking at a company’s historical PE ratio can provide valuable insights. Has the PE ratio been consistently rising? Is it lower than its 5-year average? These trends can help you understand if the current PE ratio is in line with the company’s typical valuation.
The Danger of PE Tunnel Vision
While PE ratio is a powerful tool, it’s dangerous to use it in isolation. A low PE ratio might look attractive, but it could be masking underlying problems. Always consider other factors like debt levels, revenue growth, and industry trends. It’s like checking the engine, not just the paint job, when buying a car!
PE Ratio Calculation: Crunching the Numbers

Now that we understand the importance of PE ratios, let’s roll up our sleeves and learn how to calculate them. Don’t worry – no advanced math degree required!
Step-by-Step Guide to PE Ratio Calculation
1. Find the current stock price (easily available on financial websites)
2. Locate the Earnings Per Share (EPS) in the company’s financial statements
3. Divide the stock price by the EPS
4. Voila! You have your PE ratio
For example, if a stock is trading at $100 and has an EPS of $5, the PE ratio would be 20 ($100 / $5 = 20).
Types of PE Ratios: Trailing, Forward, and Adjusted
– Trailing PE: Uses the past 12 months of earnings (most common)
– Forward PE: Uses projected future earnings (useful for growth stocks)
– Adjusted PE: Accounts for one-time events that might skew earnings
Each type has its uses, so choose the one that best fits your analysis needs!
Tools of the Trade: PE Ratio Calculators
Many financial websites offer free PE ratio calculators. Sites like Yahoo Finance, Google Finance, and Finviz provide real-time PE ratios for most publicly traded companies. These tools can save you time and ensure accuracy in your calculations.
Common Pitfalls in PE Calculations
Watch out for these common mistakes:
– Using outdated earnings data
– Not accounting for stock splits or dividends
– Ignoring the difference between GAAP and non-GAAP earnings
Remember, accurate data leads to accurate analysis!
Negative PE Ratio: When Earnings Go South

Sometimes, you might come across a stock with a negative PE ratio. Don’t panic – it’s not a glitch in the matrix!
Understanding Negative PE Ratios
A negative PE ratio occurs when a company has negative earnings (i.e., it’s losing money). It’s like having a negative balance in your bank account – not ideal, but not necessarily the end of the world.
Causes of Negative Earnings
Companies might have negative earnings due to:
– Startup costs in new businesses
– Economic downturns affecting the industry
– One-time expenses like restructuring costs
– Heavy investment in future growth
Analyzing Negative PE Stocks
When looking at stocks with negative PE ratios:
– Investigate the reasons for the negative earnings
– Look at the company’s growth prospects
– Consider the strength of the balance sheet
– Evaluate management’s strategy for returning to profitability
Remember, Amazon had negative earnings for years before becoming highly profitable!
Risks and Opportunities in Negative PE Stocks
Investing in negative PE stocks can be high-risk, high-reward. They might be on the verge of a turnaround, or they could be heading for more trouble. Always do thorough research and consider your risk tolerance before investing in these stocks.
Forward PE Ratio vs. Trailing PE Ratio: Looking Ahead or Behind?
When it comes to PE ratios, you have two main flavors to choose from: forward and trailing. Let’s break down the difference and see how they can work for you.
Trailing PE: The Rearview Mirror
Trailing PE uses the past 12 months of actual earnings. It’s like looking in your rearview mirror – you’re seeing where the company has been. This is the most commonly used PE ratio because it’s based on hard data, not estimates.
Forward PE: The Crystal Ball
Forward PE uses projected earnings for the next 12 months. It’s like having a financial crystal ball, giving you a glimpse of what analysts think the future holds. This can be particularly useful for companies expected to grow rapidly or recover from a downturn.
Pros and Cons of Each Approach
Trailing PE:
Pros: Based on actual data, more reliable
Cons: Doesn’t account for future changes
Forward PE:
Pros: Considers future prospects, useful for growth stocks
Cons: Based on estimates which may be inaccurate
Combining Both for a Fuller Picture
Smart investors often look at both trailing and forward PE ratios. Comparing the two can give you insights into market expectations. If the forward PE is much lower than the trailing PE, it might indicate that analysts expect strong earnings growth.
High PE Ratio Stocks: Growth Potential or Overvalued?
High PE ratio stocks often get a lot of attention, but are they golden opportunities or fool’s gold? Let’s dive in and find out!
Characteristics of High PE Stocks
High PE stocks typically:
– Are in high-growth industries (like tech or biotech)
– Have strong revenue growth
– Often reinvest profits into expansion rather than paying dividends
– May have lower current earnings but high future potential
Industries with Typically Higher PE Ratios
Certain industries tend to have higher PE ratios:
– Technology
– Biotechnology
– Social media
– Cloud computing
These industries often have high growth potential, which investors are willing to pay a premium for.
Risks of High PE Stocks
Investing in high PE stocks comes with risks:
– They may be overvalued and due for a correction
– High expectations can lead to dramatic drops if the company underperforms
– They’re often more volatile than lower PE stocks
Evaluating High PE Companies
When looking at high PE stocks:
– Examine the company’s growth rate – is it justifying the high PE?
– Look at the industry average – is the PE ratio out of line with peers?
– Consider the company’s competitive advantages – can it maintain its growth?
– Assess the management team – do they have a track record of delivering results?
Remember, a high PE isn’t inherently good or bad – it’s all about context and future potential!
PE Ratio in Action: Practical Applications for Investors
Now that we’ve covered the theory, let’s put PE ratios to work in your investment strategy!
Using PE Ratio for Stock Screening
PE ratios are great for initial stock screening:
– Look for stocks with PE ratios below the industry average for potential value plays
– Identify high PE stocks in growing industries for potential growth investments
– Use PE ratio ranges to filter stocks that fit your investment strategy
Comparing PE Ratios Across Sectors
Remember to compare apples to apples:
– Use sector-specific PE ratio averages as benchmarks
– Consider the growth rates of different sectors when comparing PE ratios
– Look for stocks that outperform their sector in both PE ratio and other metrics
PE Ratio as Part of Broader Analysis
While PE ratio is powerful, it’s just one tool in your toolkit:
– Combine PE ratio analysis with other financial metrics like PEG ratio, debt-to-equity ratio, and return on equity
– Consider qualitative factors like market position, brand strength, and management quality
– Look at macroeconomic factors that might affect the company or industry
Common Mistakes to Avoid
Watch out for these PE ratio pitfalls:
– Ignoring industry context when interpreting PE ratios
– Failing to consider growth rates alongside PE ratios
– Over-relying on PE ratios without considering other factors
– Not adjusting for one-time events that might skew the PE ratio
PE Ratio Peer-to-Peer Comparison: Sizing Up the Competition

One of the most powerful ways to use PE ratios is in peer-to-peer comparisons. It’s like comparing apples to apples, not apples to oranges!
Identifying Peer Groups
Start by identifying a company’s true peers:
– Companies in the same industry
– Similar market capitalization
– Comparable business models
– Similar growth stages
For example, when analyzing Apple, you might compare it to other large tech companies like Microsoft, Google, and Amazon.
Creating a Comparison Table
Create a table with key metrics for each peer:
– Current PE ratio
– Forward PE ratio
– PEG ratio (PE ratio divided by growth rate)
– Revenue growth rate
– Profit margins
This gives you a comprehensive view of how the company stacks up against its peers.
Interpreting the Results
When comparing PE ratios:
– A lower PE than peers might indicate undervaluation or slower growth expectations
– A higher PE than peers could suggest overvaluation or higher growth expectations
– Look for discrepancies between PE ratios and other metrics like growth rates or profit margins
Remember, the goal is to understand why differences exist, not just to identify them!
Case Study: Tech Giants Comparison
Let’s compare some tech giants (as of August 2024):
1. Apple (NASDAQ: AAPL): PE 28, Forward PE 25
2. Microsoft (NASDAQ: MSFT): PE 35, Forward PE 30
3. Google (NASDAQ: GOOGL): PE 25, Forward PE 22
4. Amazon (NASDAQ: AMZN): PE 60, Forward PE 45
This comparison shows that Amazon has a much higher PE ratio, reflecting higher growth expectations. Google, on the other hand, has a lower PE, which could indicate it’s undervalued compared to peers or that the market expects slower growth.
Buy, Sell, or Hold? Using PE Ratio in Investment Decisions

Now for the million-dollar question: How do you use PE ratios to decide whether to buy, sell, or hold a stock?
When to Buy Based on PE Ratio
Consider buying when:
– The PE ratio is significantly below the industry average and historical levels
– The forward PE is much lower than the trailing PE, indicating expected earnings growth
– The company’s growth rate justifies a high PE ratio
– The stock’s PE is low compared to peers, but other fundamentals are strong
Example: If the average PE ratio for tech stocks is 30, and you find a solid tech company with a PE of 20 and strong growth prospects, it might be a good buy.
When to Sell Based on PE Ratio
Consider selling when:
– The PE ratio has risen significantly above historical levels without corresponding growth
– The forward PE is much higher than the trailing PE, indicating potential earnings decline
– The stock’s PE is much higher than peers without justification
– The company’s growth rate no longer supports a high PE ratio
Example: If a stock you own has seen its PE ratio double from 25 to 50 without significant improvements in growth or profitability, it might be time to sell.
When to Hold Based on PE Ratio
Consider holding when:
– The PE ratio is in line with industry averages and the company’s historical range
– The company’s growth prospects continue to justify the current PE ratio
– The stock’s valuation is temporarily high due to short-term factors, geo global tensions.
– The PE ratio fluctuates within a reasonable range relative to the company’s fundamentals
– The company’s competitive position remains strong, even if the PE ratio is slightly high
– You believe in the long-term prospects of the company and industry
Example: If you own shares of a company with a PE ratio of 30 in an industry where the average is 25, but the company consistently outperforms its peers in growth and profitability, it might be wise to hold.
The Art of PE Ratio Interpretation
Remember, using PE ratios for investment decisions is as much an art as it is a science. Consider these factors:
– Market conditions: PE ratios tend to be higher in bull markets and lower in bear markets
– Interest rates: Lower interest rates often lead to higher PE ratios as investors seek better returns
– Company life cycle: Young, high-growth companies often have higher PE ratios than mature companies
– Sector trends: Some sectors may see PE ratio expansions due to technological advancements or changing consumer behaviors
Always combine PE ratio analysis with other fundamental and technical indicators for a well-rounded investment decision.
The Future of PE Ratios: Trends and Innovations

As we look ahead, it’s important to consider how PE ratios might evolve and what new tools investors might use alongside them.
AI and Machine Learning in PE Analysis
Artificial intelligence and machine learning are revolutionizing PE ratio analysis:
– Predictive models that forecast future PE ratios based on vast datasets
– Sentiment analysis of news and social media to gauge market perceptions
– Automated peer comparison across global markets
These tools can help investors make more informed decisions based on PE ratios and other metrics.
ESG Factors and PE Ratios
Environmental, Social, and Governance (ESG) factors are increasingly important:
– Companies with strong ESG profiles may command higher PE ratios
– Investors may need to consider “adjusted” PE ratios that account for ESG factors
– The integration of ESG metrics with traditional financial metrics like PE ratios
As sustainability becomes more critical, PE ratios may need to evolve to capture these non-financial factors.
Global Economic Shifts and PE Ratios
Global economic trends are affecting how we interpret PE ratios:
– The rise of emerging markets may lead to new benchmarks for “normal” PE ratios
– Increased global interconnectedness may necessitate more sophisticated cross-border PE comparisons
– The impact of geopolitical events on PE ratios may become more pronounced
Investors will need to adopt a more global perspective when using PE ratios in their analysis.
The Role of PE Ratios in a Data-Rich World
As more data becomes available, PE ratios will be just one piece of a larger puzzle:
– Integration of alternative data sources (e.g., satellite imagery, web scraping) with PE ratio analysis
– Real-time PE ratio updates based on high-frequency trading data
– The development of new ratios that complement or enhance traditional PE analysis
The key will be to use PE ratios as part of a holistic approach to valuation and investment decision-making.
Conclusion:
As we’ve journeyed through the world of PE ratios, from understanding their basic meaning to applying them in complex investment decisions, one thing becomes clear: this simple ratio packs a powerful punch in stock analysis. Whether you’re a seasoned investor or just dipping your toes into the stock market, mastering the PE ratio can give you a significant edge.
Remember, a PE ratio is like a Swiss Army knife in your investment toolkit – versatile and valuable, but not the only tool you need. Use it wisely, in conjunction with other financial metrics, thorough research, and a keen understanding of market trends. As you apply these insights to your investment strategy, you’ll find yourself making more informed, confident decisions.
The world of investing is ever-changing, and so too will be the way we use and interpret PE ratios. Stay curious, keep learning, and don’t be afraid to dive deep into the numbers. Your future self (and your portfolio) will thank you!
Ready to put your newfound PE ratio expertise to work? Start by analyzing a stock you’re interested in, compare it with its peers, and see what insights you can glean. Happy investing, and may your portfolio grow as impressively as your knowledge has!
FAQs:
1. What exactly is a PE ratio?
A PE ratio, or Price-to-Earnings ratio, is a valuation metric that compares a company’s stock price to its earnings per share. It’s calculated by dividing the market price per share by the earnings per share. This ratio helps investors understand how much they’re paying for each dollar of the company’s earnings.2. Is a high PE ratio always bad?
Not necessarily. A high PE ratio can indicate that investors have high expectations for the company’s future growth. This is often the case with fast-growing tech companies or emerging industries. However, it can also suggest that a stock is overvalued. It’s important to consider the PE ratio in context with other factors like industry norms, growth rates, and overall market conditions.3. How do I know if a PE ratio is “good”?
There’s no universal “good” PE ratio as it varies by industry and market conditions. Generally, a PE ratio between 15-25 is considered average. However, it’s best to compare a company’s PE ratio to its industry peers and its own historical PE ratios. A PE ratio lower than the industry average might indicate an undervalued stock, while a higher one could suggest overvaluation or high growth expectations.4. Can PE ratios be negative?
Yes, PE ratios can be negative when a company reports negative earnings (i.e., a loss). However, negative PE ratios are typically not useful for valuation purposes. In such cases, investors often look at other metrics or wait for the company to return to profitability before using the PE ratio for analysis.5. What’s the difference between trailing PE and forward PE?
Trailing PE uses the company’s actual earnings over the past 12 months, while forward PE uses projected earnings for the next 12 months. Trailing PE is based on concrete data but may not reflect recent changes in the company’s performance. Forward PE can provide insight into future expectations but relies on estimates which may not be accurate.6. Should I only use PE ratios when deciding to buy or sell stocks?
No, while PE ratios are valuable, they shouldn’t be the sole factor in your investment decisions. It’s important to consider other financial metrics, the company’s competitive position, industry trends, management quality, and overall market conditions. PE ratios are most useful when used as part of a comprehensive analysis.7. How often should I check the PE ratios of stocks I own?
It’s a good practice to review the PE ratios of your stocks quarterly, coinciding with companies’ earnings reports. However, avoid making impulsive decisions based on short-term PE ratio fluctuations. Instead, look for significant changes or trends over time, and always consider the broader context of the company’s performance and market conditions.8. Can PE ratios predict stock market crashes?
While PE ratios alone can’t predict market crashes, extremely high market-wide PE ratios can be a warning sign of overvaluation. For example, before the dot-com bubble burst in 2000, the S&P 500’s PE ratio reached unprecedented levels. However, many other factors contribute to market crashes, so PE ratios should be considered alongside other economic indicators and market trends.Disclaimer:
The information provided in this article is for educational purposes only and should not be construed as financial advice. Always conduct your own research and consult with a qualified financial advisor before making any investment decisions. PE ratios and other financial metrics can fluctuate rapidly and may not always accurately reflect a company’s true value or potential. Past performance is not indicative of future results. Investing in the stock market carries inherent risks, and you should be prepared to lose some or all of your invested capital.


Pingback: Fintechzoom Meta Stock Analysis 2024: Financials & Future