
Navigating the Market with Precision: A Comprehensive Guide to Using Stock Screeners for Fundamental Analysis in 2024
Embark on a journey through the intricate world of stock screeners and discover how they can sharpen your investment decisions through fundamental analysis. This guide is your compass to mastering the art of stock selection in the dynamic financial landscape of 2024.
I. Introduction
Investing in the stock market can be a challenging and rewarding endeavour, but it also requires careful research and analysis of the various factors that affect the performance of different companies and industries. One of the most useful tools for investors who want to conduct a thorough and systematic evaluation of potential stocks is a stock screener.
A stock screener is a software program or a web-based platform that allows users to filter and sort stocks based on various criteria, such as market capitalization, earnings, dividends, growth rate, valuation, and more. By using a stock screener, investors can narrow down their choices and focus on the stocks that meet their specific investment objectives and preferences. My name is Rahul, and I am a Blog writer and an avid investor. In this guide, I will explain the basics of stock screening, the benefits of using a stock screener, and how to use it effectively for fundamental analysis in 2024.
A. What are stock screeners?
A stock screener is like a filter that helps you find the stocks that suit your needs and goals. You can set different criteria to screen stocks based on various factors, such as how much money they make, how much they pay in dividends, how fast they grow, how cheap or expensive they are, and so on. There are many kinds of criteria you can use to screen stocks, from simple ones like market cap and P/E ratio, to more advanced ones like historical growth rates or analyst ratings.
B. Why are they important for investors?
For investors, stock screeners are indispensable because they streamline the investment process. Instead of sifting through thousands of stocks manually, an investor can use a screener to narrow down the list to a manageable number that meets their investment criteria, saving time and increasing efficiency. Stock screeners also help investors to discover new and profitable stocks that they might otherwise overlook, as well as to compare and contrast different stocks based on various metrics and indicators. By using stock screeners, investors can make more informed and rational decisions that align with their investment objectives and risk tolerance.
C. Brief overview of fundamental analysis
Fundamental analysis is the backbone of investing. It helps investors to evaluate a company’s true worth by looking at its financial performance, management quality, competitive edge, and market environment. Stock screeners are useful for applying fundamental analysis in a consistent and efficient way, as they allow investors to filter out stocks that meet their criteria and find hidden gems or growth opportunities.
II. Understanding Fundamental Analysis
Before we dive into the details of fundamental analysis, let’s first understand what it is and why it matters for investors. Fundamental analysis is a way of finding out how much a security is really worth by looking at the economic and financial factors that affect its performance. These factors include the company’s earnings, expenses, assets, and liabilities, as well as its competitive advantage and market position. By using fundamental analysis, investors can compare the security’s intrinsic value with its market price and decide whether it is overvalued or undervalued.
A. What is fundamental analysis?
If you want to know how much a stock or company is really worth, you can use fundamental analysis. This is a method that looks at the economic and financial factors that affect how a stock or company performs. For example, you can look at how much money a company makes, how much it spends, what kind of assets it owns, and what kind of debts it owes. These are some of the indicators that analysts use to assess how well a company is doing and what it can do in the future.
B. Key components of fundamental analysis
The key components of fundamental analysis include:
- Financial Statements: Balance sheet, income statement, and cash flow statement.
- Economic Indicators: GDP growth rates, unemployment rates, interest rates, and inflation.
- Industry Analysis: Competitive positioning, market share, and industry growth.
- Management Quality: Leadership effectiveness, governance, and strategic vision.
- Financial Statements: Balance sheet, income statement, and cash flow statement. These are the official records of a company’s financial performance and health. They show how much revenue and profit a company generates, how much it spends on its operations and investments, and how much cash it has on hand. By analyzing these statements, you can see how efficient, profitable, and solvent a company is.
- Economic Indicators: GDP growth rates, unemployment rates, interest rates, and inflation. These are the macroeconomic factors that affect the overall economy and the business environment. They reflect how well the economy is growing, how many people are employed, how much it costs to borrow money, and how much the prices of goods and services are rising. By monitoring these indicators, you can gauge how the economy is doing and how it may impact the demand and supply of different sectors and industries.
- Industry Analysis: Competitive positioning, market share, and industry growth. These are the microeconomic factors that affect the performance and prospects of a specific industry or sector. They reveal how competitive, attractive, and profitable an industry is, and how much potential it has for future growth. By comparing different industries, you can identify which ones are more likely to thrive or struggle in the current and future market conditions.
- Management Quality: Leadership effectiveness, governance, and strategic vision. These are the qualitative factors that affect the culture and direction of a company. They indicate how well the management team leads, oversees, and plans for the company’s success. By evaluating the management quality, you can assess how trustworthy, capable, and visionary the company’s leaders are, and how well they can execute their strategies and goals.
C. Why is fundamental analysis important for investors?
Fundamental analysis is a way of evaluating a company based on its intrinsic value, which is determined by its financial performance, growth potential, and competitive position. By using fundamental analysis, investors can find companies that are worth more than their current market price, or that have strong prospects for future profitability and expansion. Fundamental analysis also helps investors avoid companies that are overpriced, unprofitable, or facing serious challenges in their industry. By using various tools and methods, such as financial ratios, industry analysis, and management quality, investors can gain a deeper insight into a company’s strengths and weaknesses, and make better investment decisions.
D. Fundamental vs. technical analysis: A quick comparison
Fundamental analysis and technical analysis are two different approaches to evaluating stocks and making investment decisions. Fundamental analysis looks at the intrinsic value of a company, which is based on its financial performance, growth potential, and competitive position.
Fundamental analysts use various tools and methods, such as financial ratios, industry analysis, and management quality, to assess a company’s strengths and weaknesses, and to determine if its current market price reflects its true value. For example, a fundamental analyst may use the price-to-earnings ratio (P/E) to compare a company’s earnings with its share price, and see if it is undervalued or overvalued relative to its peers.
A fundamental analyst may also look at the company’s revenue, earnings, cash flow, and dividend growth, to see if it has a sustainable competitive advantage and a profitable business model.
Technical analysis, on the other hand, looks at the statistical trends and patterns of market activity, such as past prices and volume. Technical analysts believe that the market price reflects all the available information and the collective psychology of the investors, and that historical performance and price movements can predict future activity.
Technical analysts use various tools and methods, such as charts, indicators, and oscillators, to identify trends, support and resistance levels, and trading signals. For example, a technical analyst may use the moving average (MA) to track the average price of a stock over a certain period of time, and see if it is trending up or down. A technical analyst may also use the relative strength index (RSI) to measure the momentum and overbought or oversold conditions of a stock, and see if it is due for a reversal or a breakout.
III. The Role of Stock Screeners in Fundamental Analysis
Stock screeners are not just filters; they are the gatekeepers of quality in an investor’s portfolio. They serve a pivotal role in the application of fundamental analysis.
A. How do stock screeners work?
At their core, stock screeners work by applying a set of user-defined criteria to a database of stocks. These criteria can be as simple as a market cap threshold or as complex as a calculated financial ratio. The screener then returns a list of stocks that meet those criteria.
B. Benefits of using stock screeners for fundamental analysis
The benefits of using stock screeners for fundamental analysis are manifold:
- Efficiency: They save time by quickly identifying stocks that meet specific financial criteria.
- Objectivity: Screeners remove emotional bias, focusing solely on the numbers.
- Customization: Investors can tailor searches to fit their unique investment strategies.
C. Limitations of stock screeners
However, stock screeners are not without their limitations:
- Data Quality: The output is only as good as the input data.
- Overlooked Nuances: Screeners may miss qualitative factors like management quality.
- False Positives/Negatives: They might include or exclude stocks based on rigid criteria that don’t account for context.
IV. Key Features to Look for in Stock Screeners
When choosing a stock screener, certain features stand out as particularly beneficial for fundamental analysis.
A. Financial ratio filters
These allow you to screen stocks based on key financial ratios like the Price-to-Earnings (P/E) ratio or the Debt-to-Equity ratio.
B. Historical data and growth metrics
Access to historical data helps in identifying trends, while growth metrics can signal future potential.
C. Customizable screening criteria
The ability to set your own criteria is crucial for tailoring the screener to your investment strategy.
D. Real-time data updates
Markets move fast, and having up-to-date information is essential for making timely decisions.
E. Visualization tools and charts
Charts and graphs help in understanding data at a glance, which is invaluable for quick analysis.
F. Export and save capabilities
Being able to save and export data allows for further analysis and record-keeping.
Stock screeners are a fundamental analyst’s best friend, offering a way to sift through the noise and find the signals. They are a starting point, not an end-all-be-all, requiring further research and analysis to make informed investment decisions.
V. Top 10 Stock Screeners for Fundamental Analysis in 2024
In the ever-evolving world of investing, staying ahead means utilizing the best tools available. Here’s a look at the top stock screeners that have become essential for investors in 2024.
A. Finviz Elite
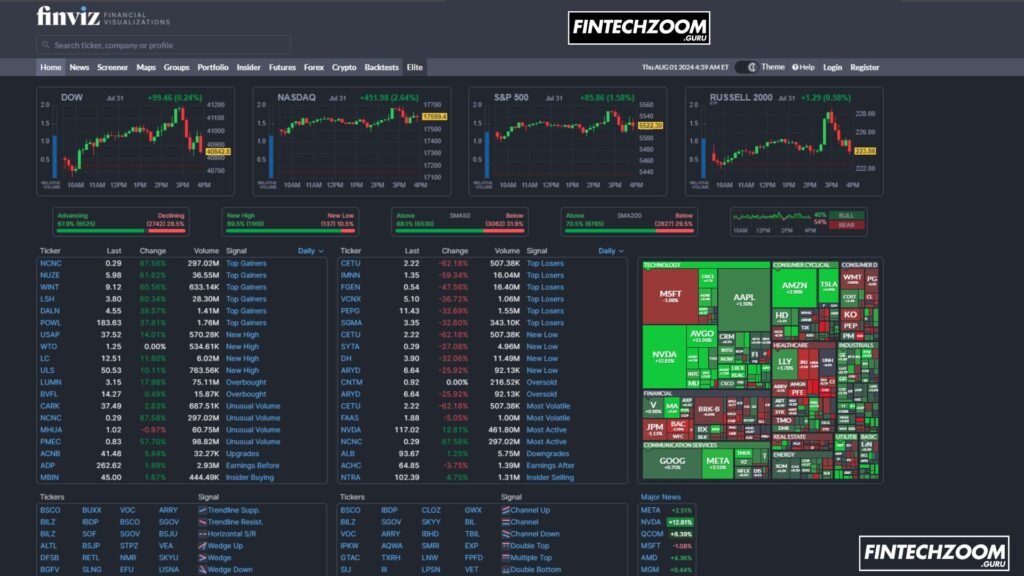
Finviz Elite stands out for its comprehensive visualization tools and extensive database of stocks.
- Pricing: Offers a tiered subscription model with a free trial period.
- Pros: Real-time data, advanced charting options, and backtesting capabilities.
- Cons: Can be overwhelming for beginners due to the complexity of features.
- User Reviews: Generally positive, with particular praise for its user-friendly interface.
- Unique Selling Points: Heatmaps and correlation charts that provide unique insights into market trends.
- Link : https://finviz.com/
B. Stock Rover
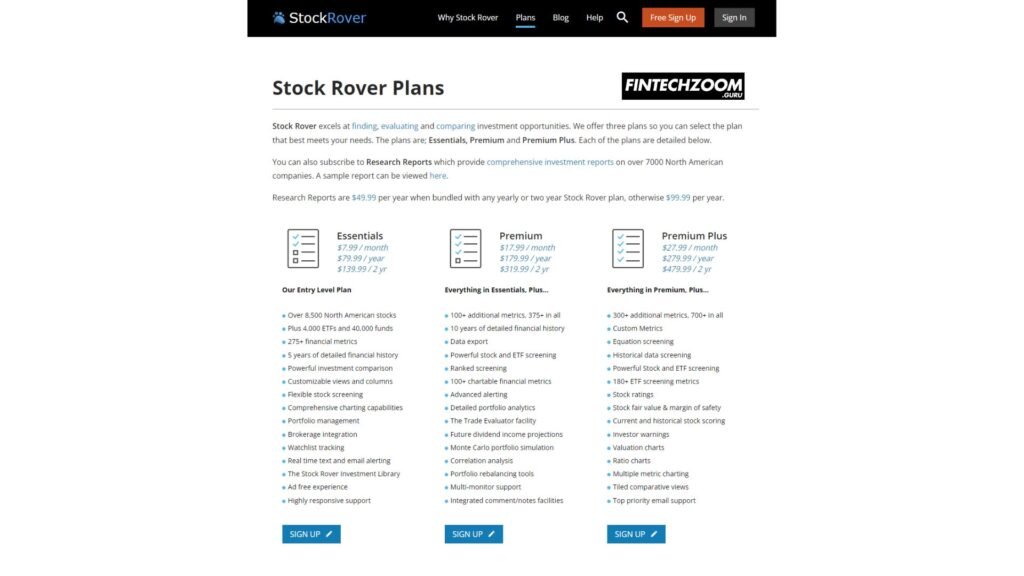
Stock Rover is known for its in-depth research capabilities and portfolio management features.
- Pricing: Multiple levels of subscriptions catering to different user needs.
- Pros: Extensive historical data, integration with brokerage accounts, and robust reporting features.
- Cons: The learning curve associated with its advanced features.
- User Reviews: Highly rated for its comprehensive analysis tools.
- Unique Selling Points: A vast library of investment metrics and customizable screener templates.
- Link : https://www.stockrover.com/
C. TradingView

TradingView is favored for its social networking aspect, allowing investors to share insights and strategies.
- Pricing: Free basic plan with optional paid upgrades for additional features.
- Pros: Collaborative environment, multi-timeframe analysis, and cloud-based platform.
- Cons: Advanced features require a subscription, and the social aspect can be distracting.
- User Reviews: Appreciated for its community-driven approach and ease of use.
- Unique Selling Points: Real-time global data and community indicators created by users.
- Link : https://www.tradingview.com
D. Morningstar
Morningstar is revered for its independent investment research and detailed analyst reports.
- Pricing: Subscription-based with a focus on long-term investors.
- Pros: Trusted ratings system, comprehensive fund analysis, and educational resources.
- Cons: Higher cost compared to some other screeners.
- User Reviews: Valued for its unbiased analysis and depth of information.
- Unique Selling Points: Proprietary metrics like the Morningstar Rating™ and Economic Moat™.
E. Yahoo Finance
Yahoo Finance remains a popular choice for its accessibility and integration with news and financial data.
- Pricing: Free with ads, premium version available.
- Pros: User-friendly, real-time quotes, and integration with Yahoo’s ecosystem.
- Cons: Limited advanced features in the free version.
- User Reviews: Favored for its ease of access and basic screening capabilities.
- Unique Selling Points: News integration and community forums for investor discussions.
F. Zacks Stock Screener
Zacks Stock Screener is notable for its ranking system and investment research.
- Pricing: Offers both free and premium services.
- Pros: Proprietary ranking system, earnings estimate revisions, and custom screener options.
- Cons: Some features locked behind the premium subscription.
- User Reviews: Users appreciate the Zacks Rank and the quality of research.
- Unique Selling Points: The Zacks Rank and the Focus List, a curated list of stocks.
G. GuruFocus
GuruFocus is tailored for value investors with tools to analyze financial strength and profitability.
- Pricing: Subscription-based with different tiers.
- Pros: Detailed financial data, guru trades, and value screeners.
- Cons: Interface can be less intuitive than competitors.
- User Reviews: Praised for its wealth of data and value investing tools.
- Unique Selling Points: Comprehensive financials and investment checklists.
H. TIKR Terminal
TIKR Terminal offers a sleek interface and access to global stocks and financials.
- Pricing: Free access to basic features, with a premium subscription for advanced tools.
- Pros: Global coverage, user-friendly design, and robust fundamental data.
- Cons: Some international data may be limited in the free version.
- User Reviews: Positive feedback for its clean design and ease of use.
- Unique Selling Points: Access to global markets and a modern interface.
I. Koyfin
Koyfin provides powerful analytics for both individual stocks and macroeconomic data.
- Pricing: Free with essential tools, premium plans for more advanced features.
- Pros: Macroeconomic dashboards, custom watchlists, and market overview.
- Cons: Premium features are necessary for full functionality.
- User Reviews: Users enjoy the macro and market analysis capabilities.
- Unique Selling Points: Strong emphasis on visual analytics and market trends.
J. Simply Wall St
Simply Wall St is acclaimed for its infographic-style reports and straightforward analysis.
- Pricing: Freemium model with a free version and a more feature-rich paid subscription.
- Pros: Visual reports, easy-to-understand analysis, and portfolio snowflake feature.
- Cons: In-depth analysis may require the paid version.
- User Reviews: Loved for its simplicity and engaging visuals.
- Unique Selling Points: Snowflake analysis that gives a quick visual snapshot of a company’s strengths and weaknesses.
These top stock screeners each offer unique features and cater to different types of investors. Whether you’re a seasoned investor or just starting out, there’s a tool out there that can enhance your approach to fundamental analysis.
VI. How to Choose the Right Stock Screener for Your Needs
Selecting the right stock screener is a personalized process that hinges on your investment strategy, goals, and preferences. Here’s how to make an informed choice.
A. Assessing your investment style and goals
Your investment style—whether you’re a value investor, growth investor, or day trader—will dictate the features you need in a screener. For instance, a value investor might prioritize screeners with deep historical data and valuation metrics.
B. Considering your budget
While some screeners offer robust features for free, others charge a premium. Balance the cost against the potential benefits to your investment process.
C. Evaluating data accuracy and coverage
The quality of a screener’s data is paramount. Ensure that the screener you choose has a reputation for accuracy and comprehensive coverage of the stocks you’re interested in.
D. Importance of user interface and ease of use
A user-friendly interface can significantly enhance your screening experience. Look for screeners that are intuitive and don’t require a steep learning curve.
E. Considering additional features (e.g., portfolio tracking, alerts)
Additional features like portfolio tracking and customizable alerts can be valuable. Determine which features align with your investment approach and can help you stay on top of market changes.
VII. Tips for Effective Use of Stock Screeners
To maximize the benefits of stock screeners, consider the following tips:
A. Starting with broad criteria and narrowing down
Begin with broad filters to get a wide range of options, then refine your criteria to zero in on the best candidates.
B. Combining fundamental and technical screens
While this guide focuses on fundamental analysis, combining it with technical analysis can provide a more holistic view of a stock’s potential.
C. Regularly updating your screening criteria
As market conditions and your investment goals evolve, so should your screening criteria. Regular updates can help you adapt to changes and uncover new opportunities.
D. Using multiple screeners for cross-verification
No single screener is perfect. Using multiple screeners can provide cross-verification and a more comprehensive view of the market.
E. Conducting further research on screened stocks
Screeners are a starting point. Always conduct further research to understand the nuances of each stock before making investment decisions.
VIII. Common Fundamental Analysis Metrics Used in Stock Screeners
When conducting fundamental analysis, certain metrics are commonly used to evaluate stocks:
A. Price-to-Earnings (P/E) ratio
The P/E ratio compares a company’s share price to its earnings per share, providing insight into how the market values a company’s earnings.
B. Price-to-Book (P/B) ratio
This ratio compares a stock’s market value to its book value, offering a measure of whether a stock is undervalued or overvalued compared to its net assets.
C. Debt-to-Equity ratio
The Debt-to-Equity ratio gives investors a sense of a company’s financial leverage and risk profile.
D. Return on Equity (ROE)
ROE measures a company’s profitability by revealing how much profit it generates with the money shareholders have invested.
E. Earnings per Share (EPS) growth
EPS growth is a sign of a company’s increasing profitability and is often a driver of stock price appreciation.
F. Dividend yield
For income-focused investors, the dividend yield is crucial as it indicates how much a company pays out in dividends relative to its share price.
G. Free Cash Flow (FCF)
FCF is the cash a company generates after accounting for cash outflows to support operations and maintain its capital assets. It’s a measure of financial flexibility.
Choosing and using the right stock screener can be a game-changer in your investment journey. By understanding your needs and how to effectively utilize these tools, you can streamline your investment process and make more informed decisions.
IX. Advanced Techniques for Using Stock Screeners
Stock screeners are not just for filtering stocks based on preset criteria; they can be powerful tools for implementing advanced investment strategies.
A. Creating custom ratios
Sophisticated investors often create custom financial ratios to evaluate stocks. For example, a custom ratio could combine elements of the P/E ratio and P/B ratio to create a unique valuation metric.
B. Backtesting screening strategies
Many screeners offer backtesting features, allowing you to test how your screening criteria would have performed in the past. This can help refine your strategy and improve future outcomes.
C. Incorporating industry-specific metrics
Different industries have different key performance indicators. For instance, retail investors might look at same-store sales, while tech investors might focus on user growth.
D. Using screeners for different market conditions
Your screening criteria should adapt to changing market conditions. In a bear market, you might focus on defensive stocks with high dividend yields, while in a bull market, you might look for high-growth stocks.
X. Potential Pitfalls and How to Avoid Them
Even the best tools can lead to poor results if used incorrectly. Here are some common pitfalls and how to avoid them:
A. Over-relying on screeners
Remember that screeners are just one part of the investment process. They should not replace thorough research and due diligence.
B. Ignoring qualitative factors
While screeners are great for quantitative analysis, they can’t evaluate qualitative factors like management quality or brand strength. Always complement screening with qualitative research.
C. Not updating screening criteria
As the economic landscape changes, so should your screening criteria. Regularly review and update your criteria to ensure they remain relevant.
D. Failing to consider market context
A stock that looks great on paper might not be a good investment in the current market context. Always consider the broader economic and market trends.
XI. Stock Screeners vs. Other Investment Research Tools
Stock screeners are just one of many tools available to investors. Here’s how they compare to others:
A. Comparison with stock picking services
Stock picking services provide curated stock recommendations, often based on proprietary research. Screeners, on the other hand, give you the tools to conduct your own research.
B. How screeners complement other research methods
Screeners work best when used in conjunction with other research methods, such as reading analyst reports, monitoring news, and studying financial statements.
C. Integrating screeners into your overall investment strategy
A well-rounded investment strategy might include using screeners to identify potential stocks, followed by deeper analysis using other tools and methods.
XII. Future of Stock Screeners and Fundamental Analysis
The future of stock screeners looks bright, with several exciting developments on the horizon:
A. Artificial Intelligence and machine learning in screening
AI and machine learning are being integrated into screeners to provide more sophisticated analysis and predictive insights.
B. Integration of alternative data sources
Screeners are beginning to incorporate alternative data sources, such as social media sentiment, supply chain data, and satellite imagery, to provide a more comprehensive view of a company’s prospects.
C. Predictive analytics in fundamental analysis
Predictive analytics can help forecast future financial performance based on historical data and trends, giving investors a potential edge.
XIII. Case Studies: Success Stories Using Stock Screeners
Case studies can provide valuable lessons on the effective use of stock screeners:
A. How professional investors use screeners
Many professional investors use screeners to quickly identify investment opportunities that they can then research in more depth.
B. Examples of successful screening strategies
Successful strategies often involve a combination of quantitative screening and qualitative analysis. For example, a strategy might start with a screener to find low P/E ratio stocks, followed by manual research to assess management quality.
XIV. Frequently Asked Questions
Here are some common questions about stock screeners:
A. Are free stock screeners good enough for beginners?
Yes, free stock screeners can be a great starting point for beginners to familiarize themselves with the basics of screening.
B. How often should I run my stock screens?
This depends on your investment strategy. Some investors run screens daily, while others do so quarterly or in response to market changes.
C. Can stock screeners help with risk management?
Absolutely. Screeners can help identify stocks with lower volatility or stronger financials, which can be less risky.
D. Are stock screeners suitable for day trading?
While screeners can be used for day trading, they are generally more suited to longer-term investment strategies.
E. How do I screen for dividend stocks?
You can set criteria such as a minimum dividend yield or a history of consistent dividend payments to find dividend stocks.
XV. Conclusion
Stock screeners are a vital tool in the investor’s toolkit, especially for those who practice fundamental analysis. They offer a way to efficiently sift through the vast universe of stocks to find those that meet your specific investment criteria.
A. Recap of the importance of stock screeners in fundamental analysis
Stock screeners help investors apply fundamental analysis at scale, allowing for the quick identification of potential investment opportunities.
B. Encouragement to start using screeners as part of investment strategy
Whether you’re a seasoned investor or just starting out, incorporating stock screeners into your investment strategy can provide significant benefits.
C. Final thoughts on choosing and using the right screener
The right stock screener can make a big difference in your investment process. Choose one that fits your needs, and use it as a starting point for deeper analysis.
XVI. Additional Resources
For those looking to expand their knowledge on fundamental analysis and stock screeners, here are some additional resources:
A. Books on fundamental analysis
- “The Intelligent Investor” by Benjamin Graham
- “Security Analysis” by Benjamin Graham and David Dodd
- “One Up On Wall Street” by Peter Lynch
B. Websites and forums for further learning
- Investopedia
- Morningstar
- Seeking Alpha
C. Video tutorials on using stock screeners effectively
Many financial websites and stock screener platforms offer video tutorials to help you get the most out of their tools.
This comprehensive guide has covered everything from the basics of stock screeners and fundamental analysis to advanced techniques and future trends. By understanding and utilizing these tools effectively, you can enhance your investment strategy and make more informed decisions.


Pingback: 10 Best Technical Analysis Patterns for Day Trading in 2024
Pingback: Smart Investment FinTechZoom in 2024: Top 10 Strategies