

Technical Analysis by FintechZoom
Introduction:
Hey there, aspiring day trader! Ready to dive into the exciting world of technical analysis patterns? You’re in for a treat! Did you know that a whopping 90% of world-class traders swear by technical analysis? It’s true! These patterns are like secret codes hidden in price charts, waiting for savvy traders like you to crack them.
Now, I know what you’re thinking – “Technical analysis? Sounds complicated!” But trust me, it’s not as scary as it sounds. In fact, once you get the hang of it, you’ll wonder how you ever traded without it. It’s like having a trading superpower!
In this guide, we’re going to explore the 10 best technical analysis patterns that every day trader should have in their toolkit for 2024. Whether you’re a complete newbie or you’ve been around the trading block a few times, these patterns will help you spot potential market moves before they happen. It’s like having a crystal ball, but way more reliable!
So, grab your Favorite trading beverage, get comfy, and let’s embark on this journey to trading mastery together. By the time we’re done, you’ll be spotting patterns like a pro and making more informed trading decisions. Ready to level up your trading game? Let’s go!
Get Free TradingView Account -> Get $15 in your TradingView Account in 2024 (Referral Link)
History of Technical Analysis:
Technical analysis is a method of studying financial market data from the past to identify patterns and trends. This approach has a long history, dating back to the 17th century when Joseph de la Vega observed the Dutch markets and wrote about his findings. In Asia, a similar method was invented by Homma Munehisa in the 18th century, which resulted in the use of candlestick charts, a common tool for technical analysis.
One of the key contributors to the field was journalist Charles Dow (1851-1902), who gathered and examined data from the American stock market and published his opinions in The Wall Street Journal. He suggested that patterns and business cycles could be detected from this data, a concept that later became known as “Dow theory“. However, Dow did not recommend that his ideas could be used as a trading strategy.
In the 1920s and 1930s, Richard W. Schabacker wrote several books that continued the work of Charles Dow and William Peter Hamilton in their books Stock Market Theory and Practice and Technical Market Analysis. In 1948, Robert D. Edwards and John Magee wrote Technical Analysis of Stock Trends which is widely regarded as one of the foundational works of the discipline. It focuses on trend analysis and chart patterns and is still relevant today. Early technical analysis was mainly based on chart analysis because computers did not have the processing power for the modern level of statistical analysis.
Charles Dow is said to have created a form of point and figure chart analysis. With the rise of behavioral finance as a separate branch of economics, Paul V. Azzopardi combined technical analysis with behavioral finance and named it “Behavioral Technical Analysis“.
Other innovators of analysis techniques include Ralph Nelson Elliott, William Delbert Gann, and Richard Wyckoff who developed their own techniques in the early 20th century.
Understanding the Importance of Technical Analysis in Day Trading
What is Technical Analysis and Why Does it Matter?
Technical analysis is the backbone of successful day trading. But what exactly is it? Well, imagine you’re a detective trying to solve a mystery. Instead of looking for fingerprints and DNA samples, you’re analyzing price charts, volume data, and historical patterns. That’s technical analysis in a nutshell!
At its core, technical analysis is the study of market action, primarily through the use of charts, to forecast future price trends. It’s based on the idea that all relevant market information is reflected in the price, and that prices move in trends and patterns that tend to repeat over time.
But why does this matter for day traders? Well, as a day trader, you’re in and out of positions quickly, often within the same trading day. You don’t have the luxury of waiting for long-term fundamental factors to play out. Instead, you need to make quick decisions based on what the market is doing right now. And that’s where technical analysis shines!
The Benefits of Using Technical Analysis Patterns for Short-Term Trading
Now, let’s talk about why technical analysis patterns are particularly useful for short-term traders like yourself. First off, these patterns provide a structured approach to analyzing market movements. Instead of relying on gut feelings or random guesses, you’re basing your decisions on proven patterns that have been observed and studied by traders for decades.
Secondly, technical analysis patterns help you identify potential entry and exit points for your trades. They can signal when a trend is likely to reverse or continue, giving you valuable insights into when to buy or sell. This can help you maximize your profits and minimize your losses – and isn’t that what trading is all about?
Lastly, technical analysis patterns work across different markets and timeframes. Whether you’re trading stocks, forex, or cryptocurrencies, and whether you’re looking at 1-minute charts or daily charts, these patterns can be applied. Talk about versatility!
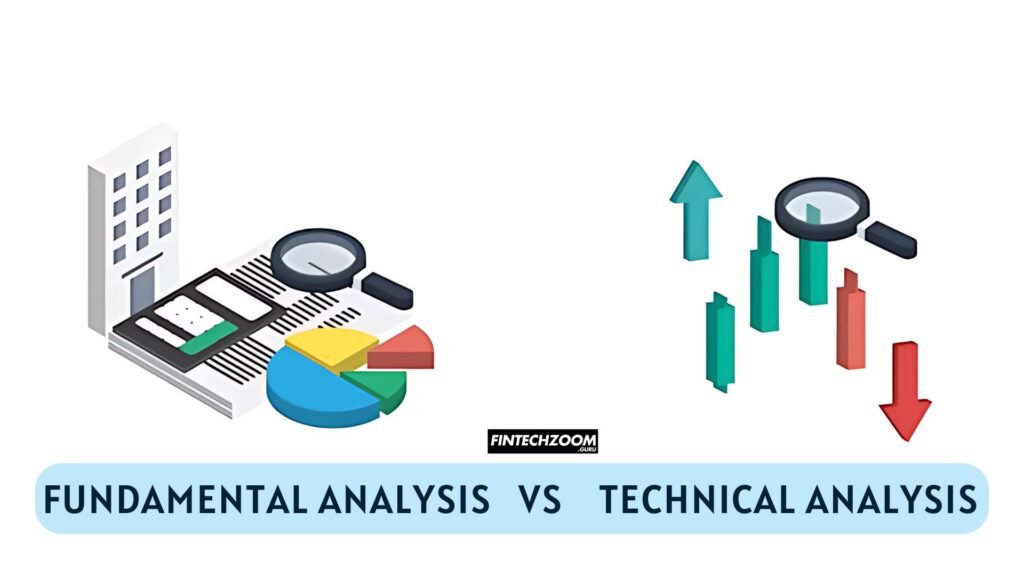
How Technical Patterns Complement Fundamental Analysis
Learn More about Fundamental Analysis here -> Stock Screeners for Fundamental Analysis in 2024
Now, I know some of you might be thinking, “But what about fundamental analysis? Isn’t that important too?” Absolutely! In fact, technical analysis and fundamental analysis are like peanut butter and jelly – they’re great on their own, but even better together.
While fundamental analysis looks at the underlying factors that affect a company’s value (like earnings, industry trends, and economic conditions), technical analysis focuses on price movements and trading volumes. By combining both approaches, you get a more comprehensive view of the market.
For example, let’s say fundamental analysis tells you that a company is undervalued. That’s great information, but it doesn’t tell you exactly when to buy. This is where technical analysis comes in. By looking at the price patterns, you can identify the optimal entry point to maximize your potential profits.
Remember, successful trading isn’t about choosing between technical analysis and fundamental analysis – it’s about using both to make the most informed decisions possible.
Top 5 Reversal Patterns for Day Traders
The Power of the Head and Shoulders Pattern
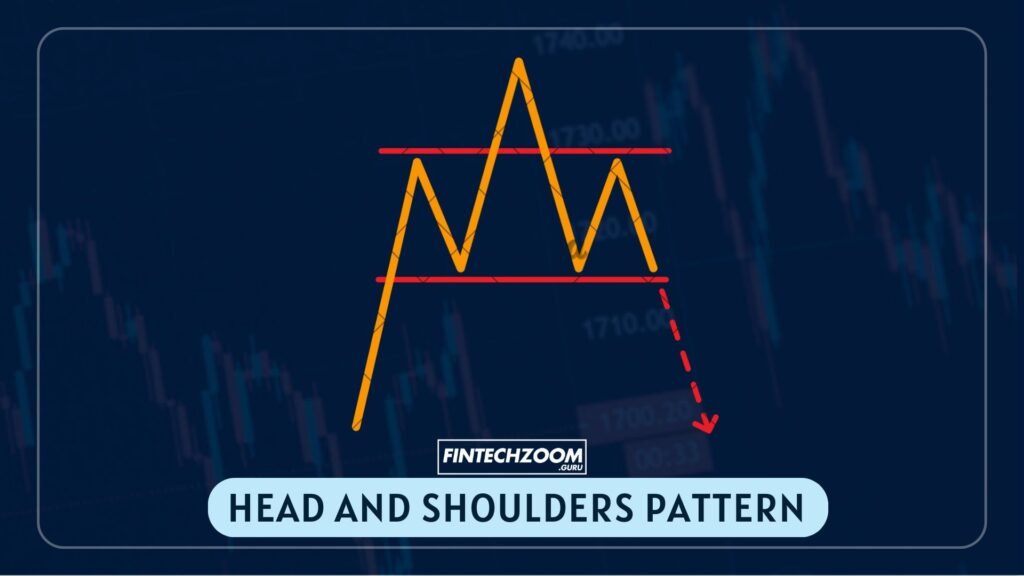
Let’s kick things off with the Head and Shoulders pattern – a true classic in the world of technical analysis. This pattern is like the Hollywood star of chart patterns – it’s well-known, easily recognizable, and often signals a dramatic turn of events!
The Head and Shoulders pattern consists of three peaks – a central peak (the head) that’s higher than the two surrounding peaks (the shoulders). When this pattern forms after an uptrend, it often signals a potential reversal to a downtrend.
Why is this pattern so powerful? Well, it gives us a clear picture of the battle between buyers and sellers. The left shoulder shows the buyers still in control, the head represents their last hurrah, and the right shoulder shows the sellers taking over. When the price breaks below the “neckline” (the support level connecting the two shoulders), it’s often a strong signal that the trend has reversed.
As a day trader, spotting a Head and Shoulders pattern can be like finding gold. It can signal a prime opportunity to open a short position or close out a long one. Just remember, like all patterns, it’s not foolproof – always use other indicators to confirm your analysis.
Double Top and Double Bottom Patterns: The Dynamic Duo
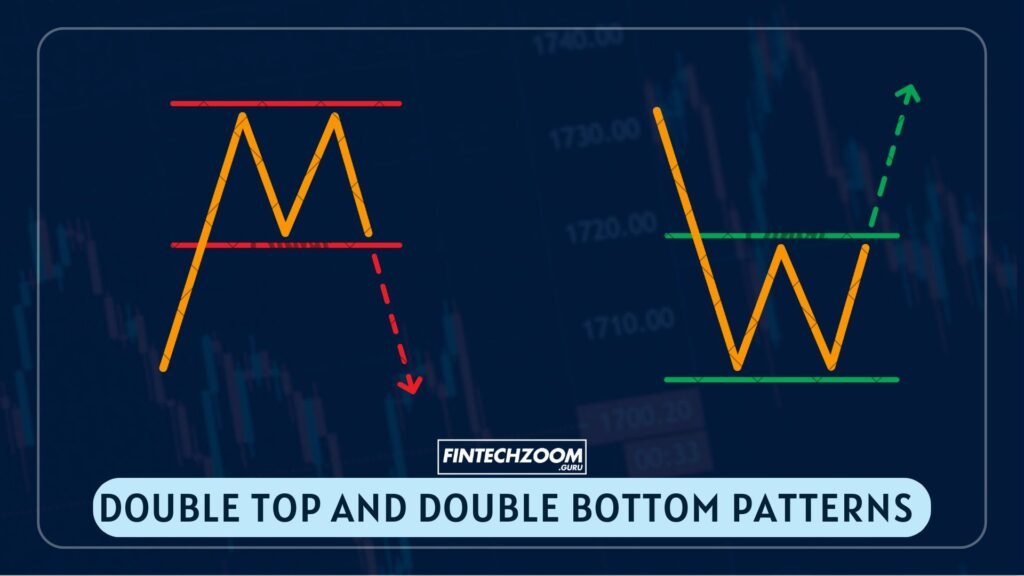
Next up, we have the Double Top and Double Bottom patterns. These patterns are like twins – they’re mirror images of each other and both can signal powerful reversals.
A Double Top forms when the price reaches a high point, pulls back, then reaches the same high point again before declining. It looks like the letter “M” on your chart. On the flip side, a Double Bottom forms when the price hits a low point twice, with a peak in between, forming a “W” shape.
These patterns are significant because they show that the market has tried and failed to break through a certain level twice. In the case of a Double Top, it suggests that despite two attempts, the bulls couldn’t push the price higher. For a Double Bottom, it shows the bears couldn’t drive the price lower.
For day traders, these patterns can be golden opportunities. A confirmed Double Top might signal it’s time to open a short position, while a Double Bottom could indicate a good time to go long. Remember, patience is key here – wait for the pattern to fully form and confirm before making your move.
Bullish and Bearish Engulfing Patterns: Quick Reversals in Candlestick Charts
Now, let’s dive into the world of candlestick charts with the Bullish and Bearish Engulfing patterns. These patterns are like the quick-change artists of the trading world – they can signal rapid reversals in just two candlesticks!
A Bullish Engulfing pattern occurs when a small bearish (red) candlestick is followed by a larger bullish (green) candlestick that completely “engulfs” the previous day’s candle. It suggests that the bulls have taken control from the bears and could signal the start of an uptrend.
Conversely, a Bearish Engulfing pattern happens when a small bullish candle is followed by a larger bearish one that engulfs it. This indicates the bears have overwhelmed the bulls and could signal the beginning of a downtrend.
These patterns are particularly useful for day traders because they form quickly and can signal rapid changes in market sentiment. They’re often most reliable when they appear at the end of a trend, potentially signaling a reversal.
Island Reversal Pattern: Gaps That Signal a Change in Direction
The Island Reversal pattern is like a little oasis of price action, separated from the rest of the trend by gaps on both sides. It’s a relatively rare pattern, but when it forms, it can signal a powerful reversal.
An Island Reversal consists of a gap in one direction, followed by a period where prices trade in a narrow range (forming the “island”), and then a gap in the opposite direction. It can be bullish (forming at the bottom of a downtrend) or bearish (forming at the top of an uptrend).
What makes this pattern so powerful? It’s all about the gaps. Gaps represent areas where no trading has taken place, often due to a significant shift in sentiment. When you see two gaps forming an island, it’s a strong sign that the market has dramatically changed its mind about the direction of the trend.
For day traders, an Island Reversal can provide a clear signal to enter a trade in the direction of the reversal. However, as always, it’s important to use other indicators to confirm the reversal before making your move.
Hammer and Shooting Star Patterns: Single Candlestick Reversals
Last but not least in our reversal pattern lineup, we have the Hammer and Shooting Star patterns. These patterns are like the espresso shots of the trading world – small, but packing a powerful punch!
The Hammer pattern forms at the bottom of a downtrend. It has a small body at the top of the candle and a long lower wick, looking like, well, a hammer! This pattern suggests that despite selling pressure driving the price down (the long wick), buyers stepped in and pushed the price back up by the close (the small body at the top).
The Shooting Star is the bearish equivalent, forming at the top of an uptrend. It has a small body at the bottom and a long upper wick, resembling an inverted hammer or a shooting star. This pattern indicates that despite buying pressure pushing the price up during the period (the long upper wick), sellers took control and pushed the price back down by the close.
These patterns are particularly useful for day traders because they can form in a single trading period, potentially signaling a quick reversal. When you spot one of these patterns, it might be time to consider closing out your existing position or opening a new one in the direction of the potential reversal.
Remember, while these single-candle patterns can be powerful signals, they’re most reliable when confirmed by other indicators or patterns. Don’t bet the farm on a single candle!
5 Continuation Patterns Every Day Trader Should Know
Bull and Bear Flags: Spotting Short-Term Trend Continuations
Alright, let’s shift gears and talk about continuation patterns, starting with Bull and Bear Flags. These patterns are like the halftime shows of the trading world – they signal a brief pause in the action before the main trend continues.
A Bull Flag forms during an uptrend. It consists of a strong upward move (the flagpole), followed by a period of consolidation where the price moves slightly lower in a narrow range (the flag). This consolidation is usually caused by profit-taking or uncertainty, but if the overall sentiment remains bullish, the uptrend will likely continue.
A Bear Flag is the opposite – it forms during a downtrend. You’ll see a sharp downward move (the flagpole), followed by a slight upward consolidation (the flag). Again, this pause is often due to profit-taking or uncertainty, but if bearish sentiment prevails, the downtrend is likely to resume.
For day traders, these patterns are golden opportunities. They allow you to enter a trade in the direction of the main trend, often at a better price than if you had chased the initial move. The key is to wait for the breakout from the flag pattern in the direction of the main trend before entering your trade.
Ascending and Descending Triangles: Predicting Breakouts
Next up, we have Ascending and Descending Triangles. These patterns are like pressure cookers – they show a buildup of tension that’s likely to result in a breakout.
An Ascending Triangle forms when the price is making higher lows, but encountering resistance at a fixed upper level. This creates a triangle shape on the chart, with a flat top and an upward-sloping bottom. It’s typically considered a bullish pattern, suggesting that buyers are becoming more aggressive and a breakout to the upside is likely.
A Descending Triangle is the bearish mirror image. Here, the price is making lower highs, but finding support at a fixed lower level. This creates a triangle with a flat bottom and a downward-sloping top. It suggests that sellers are becoming more aggressive, and a breakdown below the support level is likely.
For day traders, these patterns can be incredibly valuable. They not only signal a potential breakout but also give you a clear level to watch for that breakout. Once the price breaks out of the triangle (upwards for an Ascending Triangle, downwards for a Descending Triangle), it often moves quickly, providing opportunities for profitable trades.
Cup and Handle Pattern: Identifying Bullish Continuations
Now, let’s talk about a pattern that’s named after something you might find in your kitchen – the Cup and Handle pattern. This pattern is like a calm sea followed by a small ripple, often signaling smooth sailing ahead for the bulls.
The Cup and Handle pattern forms after an upward price movement. The “cup” is a bowl-shaped consolidation, followed by a short pullback forming the “handle”. This pattern suggests that after a period of consolidation (the cup), the bulls have regained control (the handle), and the upward trend is likely to continue.
What makes this pattern powerful is that it shows a period of consolidation followed by a breakout. The cup represents a period where selling pressure gradually gives way to buying pressure. The handle is a final small dip before the upward trend resumes.
For day traders, the Cup and Handle can provide a clear entry point. The usual strategy is to enter a long position when the price breaks above the high of the handle. The depth of the cup can often provide a guideline for a potential price target.
Pennants: Recognizing Short Consolidation Periods
Pennants are like the sprinters of chart patterns – they form quickly and often signal a rapid continuation of the previous trend. These patterns are similar to Bull and Bear Flags but tend to be shorter in duration and more symmetrical.
A Pennant forms after a sharp price movement (the flagpole). Then, the price consolidates into a symmetrical triangle shape (the pennant). This consolidation is typically brief, lasting only a few candles. After this short pause, the price is expected to continue in the same direction as the initial sharp movement.
Bullish Pennants form during uptrends and break upwards, while Bearish Pennants form during downtrends and break downwards. The key to trading Pennants is to watch for the breakout from the consolidation pattern. Once the price breaks out of the Pennant in the direction of the prior trend, it often moves quickly, providing opportunities for quick profits.
For day traders, Pennants can be extremely useful due to their quick formation and the rapid moves that often follow them. They provide clear entry points and often come with significant momentum, which can lead to profitable trades if managed correctly.
Rectangle Pattern: Trading Range-Bound Markets
Last but not least, let’s discuss the Rectangle pattern. This pattern is like a ping-pong match between support and resistance levels, and it can offer multiple trading opportunities for the savvy day trader.
A Rectangle pattern forms when the price bounces between two parallel horizontal lines, creating a channel. The upper line acts as resistance, while the lower line acts as support. This pattern can be either a continuation or a reversal pattern, depending on which direction the price breaks out.
During the formation of a Rectangle, the price is essentially range-bound. This can create opportunities for range trading – buying near the support level and selling near the resistance level. However, the real excitement comes when the price finally breaks out of the Rectangle.
A breakout above the resistance level is typically seen as bullish, suggesting that buyers have finally overcome selling pressure. Conversely, a breakdown below the support level is bearish, indicating that sellers have overwhelmed buying pressure.
For day traders, Rectangle patterns can be a goldmine of opportunities. They offer chances for both range trading and breakout trading, depending on your strategy and risk tolerance. The key is to be patient, wait for clear signals, and always use proper risk management techniques.
How to Incorporate Technical Analysis Patterns into Your Day Trading Strategy
Steps to Identify and Confirm Patterns on Charts
Now that we’ve covered the top technical analysis patterns, let’s talk about how to actually use them in your day trading strategy. The first step is learning to identify these patterns reliably. Here’s a step-by-step approach:
- Start with the bigger picture: Before diving into pattern identification, look at the overall trend. Is the market trending up, down, or sideways? This context is crucial for interpreting patterns correctly.
- Look for familiar shapes: As you scan your charts, keep an eye out for the shapes we’ve discussed
- Look for familiar shapes: As you scan your charts, keep an eye out for the shapes we’ve discussed. Remember, patterns won’t always be perfect, but they should be recognizable.
- Check the volume: Volume often confirms the validity of a pattern. For example, in a Head and Shoulders pattern, volume typically decreases as the pattern forms and increases on the breakout.
- Wait for confirmation: Don’t jump the gun! Wait for the pattern to complete and confirm before making a trade. For example, with a Double Top, wait for the price to break below the neckline before considering a short position.
- Use multiple timeframes: Confirm patterns on different timeframes. A pattern that appears on a 5-minute chart might look different on a 1-hour chart, and both perspectives can be valuable.
Using Multiple Timeframes to Validate Patterns
Speaking of multiple timeframes, let’s dive deeper into why this approach is so crucial for day traders. Using multiple timeframes is like having a microscope and a telescope at the same time – you get to see both the details and the big picture.
Start with a higher timeframe to understand the overall trend. This could be a daily or 4-hour chart for day traders. Then, zoom in to a lower timeframe (like 15-minute or 5-minute charts) to find specific entry and exit points.
For example, if you spot a bullish trend on a 4-hour chart, you might then look for bullish patterns like Flags or Pennants on a 15-minute chart to time your entry. This multi-timeframe approach helps you align your short-term trades with the longer-term trend, potentially increasing your chances of success.
Combining Patterns with Other Technical Indicators for Confirmation
While patterns are powerful on their own, combining them with other technical analysis indicators can provide even stronger signals. It’s like having a team of detectives working on the same case – the more evidence you gather, the more confident you can be in your conclusion.
Here are some popular indicators to use alongside chart patterns:
- Moving Averages: These can help confirm trend direction and provide support/resistance levels.
- Relative Strength Index (RSI): This can help identify overbought or oversold conditions, which can be particularly useful when trading reversal patterns.
- Volume: As mentioned earlier, volume can confirm the strength of a pattern or signal potential reversals.
- MACD (Moving Average Convergence Divergence): This can help confirm trend direction and momentum.
- Fibonacci retracements: These can help identify potential reversal points, which can be useful when trading continuation patterns.
Remember, no single indicator is perfect. The goal is to use a combination of tools to build a more complete picture of market conditions.
Risk Management Techniques When Trading Based on Patterns
Now, let’s talk about something that’s absolutely crucial for every trader: risk management. Even the most reliable patterns can fail, so it’s essential to have solid risk management techniques in place.
- Use Stop-Loss Orders: Always set a stop-loss order when you enter a trade. For pattern-based trades, a common approach is to set the stop-loss just beyond the pattern’s boundary. For example, with a Head and Shoulders pattern, you might set your stop-loss just above the right shoulder.
- Follow the Risk-Reward Ratio: Before entering a trade, calculate your potential profit (reward) versus your potential loss (risk). A common rule of thumb is to aim for a risk-reward ratio of at least 1:2, meaning your potential profit should be at least twice your potential loss.
- Position Sizing: Don’t risk too much on a single trade. Many professional traders risk no more than 1-2% of their trading capital on a single position.
- Take Partial Profits: Consider taking partial profits as the trade moves in your favor. This can help lock in some gains while still allowing for further upside.
- Use Trailing Stops: As your trade becomes profitable, consider using a trailing stop to protect your gains while still allowing the trend to continue.
Remember, the goal isn’t just to make money – it’s to protect your capital so you can continue trading over the long term.
Common Mistakes to Avoid When Trading with Technical Patterns
The Danger of Over-Relying on a Single Pattern
One of the biggest mistakes new traders make is becoming overly reliant on a single pattern. It’s like trying to build a house with just a hammer – you might be able to do some things, but you’re severely limiting your capabilities.
Each pattern has its strengths and weaknesses, and no pattern works 100% of the time. Market conditions change, and a pattern that worked beautifully last week might be less effective this week.
To avoid this pitfall:
- Learn multiple patterns and understand when each is most effective.
- Don’t force patterns where they don’t exist. If you can’t clearly see a pattern, it’s probably not there.
- Always use other forms of analysis to confirm your pattern-based trades.
- Keep learning and adapting. The markets are always evolving, and so should your strategy.
The Importance of Considering Broader Market Context
Another common mistake is focusing so intently on a specific pattern that you lose sight of the bigger picture. It’s like looking at a tree and forgetting you’re in a forest.
Patterns don’t exist in isolation – they’re part of the broader market context. A bullish pattern might be less reliable if the overall market is bearish, or if there’s significant negative news about the company or sector.
To avoid this mistake:
- Always start your analysis with a look at the broader market trends.
- Stay informed about market-moving news and events.
- Consider how different markets (stocks, bonds, commodities, etc.) are interacting.
- Use multiple timeframes in your analysis to get a more complete picture.
The Critical Role of Proper Stop-Loss Orders
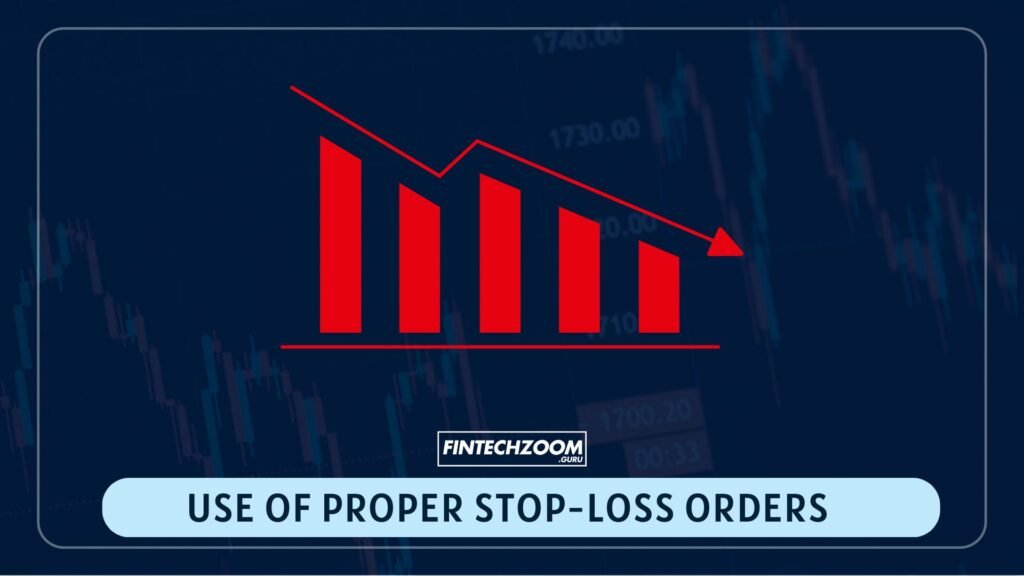
We touched on this earlier, but it’s so important it bears repeating: failing to use proper stop-loss orders is a critical mistake that can devastate your trading account.
It’s human nature to hope that a losing trade will turn around, but hope is not a strategy. Without a stop-loss, a small loss can quickly turn into a large one, potentially wiping out days or weeks of gains.
To use stop-losses effectively:
- Always set a stop-loss when you enter a trade.
- Place your stop-loss at a level that gives the trade room to breathe, but also protects your capital.
- Stick to your stop-loss. Don’t be tempted to move it further away just because the trade is going against you.
- Consider using trailing stops to protect profits as the trade moves in your favor.
Avoiding the Trap of Mistaking Random Price Movements for Patterns
In the world of trading, our brains are wired to see patterns – sometimes even when they’re not really there. This phenomenon, known as pareidolia, can lead traders to see “patterns” in what are actually random price movements.
This can be particularly dangerous because it can lead to taking trades based on non-existent signals, potentially resulting in losses.
To avoid this trap:
- Be patient. Wait for clear, well-formed patterns rather than jumping at the first hint of a pattern.
- Use multiple confirmations. Don’t rely solely on the pattern – use other indicators and analysis to confirm.
- Be aware of your own biases. If you’re hoping for a certain outcome, you might be more likely to “see” patterns that support that outcome.
- Keep a trading journal. Record your trades and the patterns you based them on. Over time, this can help you distinguish between reliable patterns and random movements.
Conclusion:
Congratulations! You’ve just leveled up your day trading game by mastering these 10 powerful technical analysis patterns. Remember, these patterns are like tools in your trading toolbox – the more you practice using them, the more skilled you’ll become.
But here’s the thing – trading isn’t just about recognizing patterns. It’s about understanding the story those patterns are telling about market sentiment and trader psychology. It’s about combining pattern recognition with solid risk management and a deep understanding of market dynamics.
As you go forward, keep learning, keep practicing, and most importantly, keep refining your strategy. The markets are always changing, and the best traders are those who can adapt.
So, are you ready to put these patterns to work? Fire up your charts, start spotting those setups, and remember – every master was once a beginner. Happy trading!
FAQs:
1. How reliable are technical analysis patterns in day trading?
Technical analysis patterns can be quite reliable when used correctly, but they’re not infallible. Their reliability often depends on factors like market conditions, the specific pattern, and how it’s confirmed by other indicators. It’s important to use patterns as part of a broader trading strategy rather than relying on them exclusively.2. Can these patterns be applied to all financial markets?
Yes, these patterns can generally be applied across various financial markets, including stocks, forex, commodities, and cryptocurrencies. However, the effectiveness of certain patterns may vary depending on the specific characteristics of each market.3. How long does it typically take to become proficient in recognizing these patterns?
The time it takes to become proficient varies from person to person. With dedicated practice, many traders start to recognize patterns reliably within a few months. However, truly mastering pattern recognition and effectively incorporating it into a profitable trading strategy can take much longer, often a year or more of consistent practice and learning.4. Are there any software tools that can help identify these patterns automatically?
Yes, there are many charting platforms and trading software that include pattern recognition tools. These can be helpful, especially for beginners. However, it’s important to learn to recognize patterns yourself rather than relying solely on software, as human judgment is often crucial in interpreting patterns in the context of broader market conditions.5. How should I adjust my strategy if a pattern fails?
Pattern failures are a normal part of trading. If a pattern fails, the most important thing is to stick to your predefined stop-loss to limit your losses. After exiting the trade, take time to analyze why the pattern might have failed. Was there a news event? Did you misinterpret the pattern? Use this information to refine your strategy for future trades.Disclaimer: The information provided in this article is for educational purposes only and should not be considered financial advice. Day trading involves significant risk and may not be suitable for all investors. Always conduct your own research and consider seeking advice from a qualified financial professional before making any investment decisions.


Pingback: FintechZoom Adobe Stock Full Analysis (Nasdaq:ADBE) 2024
Pingback: Crypto FintechZoom: Unlock Wealth in the Digital Gold Rush 2024